
 Authorization

“Renewables were already expanding quickly, but the global energy crisis has kicked them into an extraordinary new phase of even faster growth as countries seek to capitalise on their energy security benefits. …The world is set to add as much renewable power in the next five years as it did in the previous 20 years,” said IEA Executive Director Fatih Birol.
On December 6, 2022, the International Energy Agency (IEA) presented its annual World Energy Outlook 2022.
This year World Energy Outlook explores three scenarios:
Low‐emissions sources now account for around 40% of electricity generation, with 30% coming from renewables and another 10% from nuclear. Deployment of solar PV and wind power accelerates in all scenarios, setting new records every year to 2030: by mid‐century their combined share of these two technologies in the electricity mix reaches 45% in the STEPS and 60% in the APS.
Within ten years, if countries are taking the necessary action to deliver on their climate pledges, the world will be deploying around 210 GW of wind capacity each year and 370 GW of solar.
The balance of deployment varies by region and country. In the United States and India, for example, solar PV becomes the leading technology. By contrast, the European Union moves towards an electricity system dominated by onshore and offshore wind, with both sources combined accounting for more than 40% of total generation in 2050 in the STEPS and over 50% in the APS and NZE Scenario.
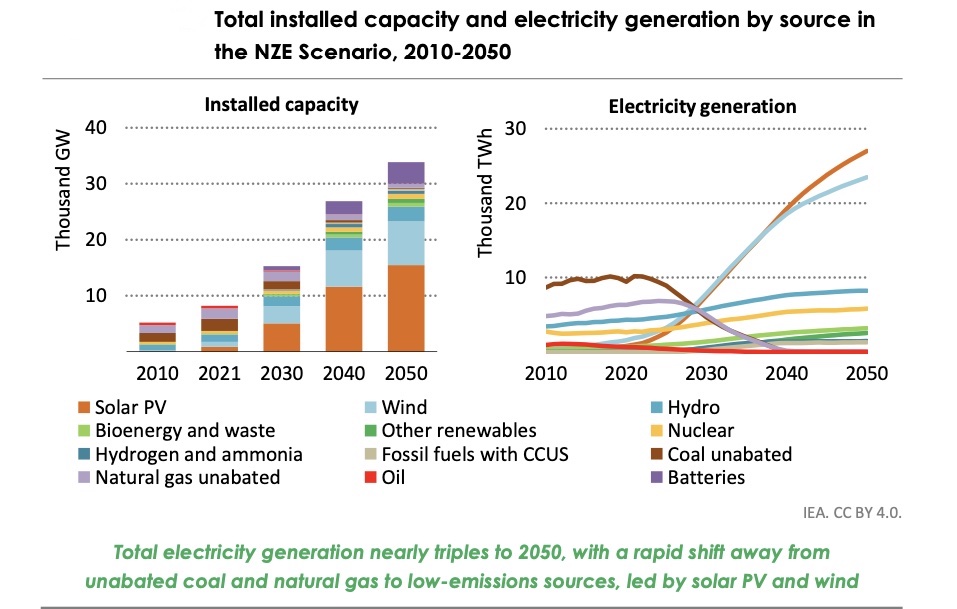
Renewables rapidly become the foundation of the global electricity sector in the NZE Scenario. The share of renewables in electricity generation rises from 28% in 2021 to over 60% in 2030, and nearly 90% in 2050. The total installed capacity of renewables triples to 2030 and rises sevenfold to 2050. Annual renewables capacity additions quadruple from 290 GW in 2021 to nearly 1 200 GW in 2030, and average above
1 050 GW from 2031 to 2050.
Solar PV additions expand more than fourfold to 650 GW by 2030, and wind additions to over 400 GW, with more than 20% of this from the developing offshore wind industry.
China, USA and India will become the centers of RES deployment. By 2030, thanks in large part to the US Inflation Reduction Act, annual solar and wind capacity additions in the United States grow two‐and‐a‐half‐times over today’s levels. New targets continue to spur the massive build‐out of clean energy in China. India makes further progress towards its domestic renewable capacity target of 500 GW in 2030.
In the NZE Scenario, electricity becomes the new linchpin of the global energy system. Total electricity generation grows by 3.3% per year to 2050, which is faster than the global rate of economic growth across the period. Annual capacity additions of all renewables quadruple from 290 GW in 2021 to around 1 200 GW in 2030. With renewables reaching over 60% of total generation in 2030, no new unabated coal‐ fired plants are needed.
A huge increase in energy investment is essential to reduce the risks of future price spikes and volatility, and to get on track for net zero emissions by 2050. From USD 1.3 trillion today, clean energy investment rises above USD 2 trillion by 2030 in the STEPS, but it would have to be above USD 4 trillion by the same date in the NZE Scenario. Today, for every USD 1 spent globally on fossil fuels, USD 1.5 is spent on clean energy technologies. By 2030, in the NZE Scenario, every USD 1 spent on fossil fuels is outmatched by USD 5 on clean energy supply and another USD 4 on efficiency and end-uses.
Total energy sector employment increases from just over 65million today to 90 million in 2030 in the NZE Scenario. New jobs in clean energy industries reach 40 million by 2030, outweighing job losses in the fossil fuel‐related industries. Fossil fuel supply jobs decrease by 7 million by 2030 in the NZE Scenario, with coal supply seeing the sharpest decline as mechanisation and decarbonisation efforts lead to further downsizing of the industry.

 Home
Home